Wilcoxon_test
Yutian
2022-12-07
From the density plot in the home page, it can be seen that avg_glucose_level is not normally distribution, therefore, Wilcoxon test will be performed to find out whether the difference in two groups is significant.
The Wilcoxon test, is a nonparametric statistical test that compares two paired groups. The tests essentially calculate the difference between sets of pairs and analyze these differences to establish if they are statistically significantly different from one another.
H0: There is no statistically significant difference between people who suffered a stroke and people who did not suffer a stroke in this sample data
H1: There is a statistically significant difference between people who suffered a stroke and people who did not suffer a stroke in this sample data
If the p-value is less than 0.05, we reject the null hypothesis that there’s no difference between the means and conclude that a significant difference does exist
test <- wilcox.test(stroke$avg_glucose_level ~stroke$stroke_t)
test
##
## Wilcoxon rank sum test with continuity correction
##
## data: stroke$avg_glucose_level by stroke$stroke_t
## W = 471082, p-value = 3.583e-09
## alternative hypothesis: true location shift is not equal to 0The p-value (p-value < 0.05) indicates that we can reject the null hypothesis, and conclude that at the 5% significance level average glucose level are significantly different between stroke patients and subjects without stroke.
Wilcoxon test
Null and alternative hypothesis of the Wilcoxon test are as follows:
Supplementary Figures
Supplementary Figure 1
It is an interactive plot, although this box plot displays a higher median average glucose level value in stroke patients, the scatters show that the average glucose level of stroke patients is concentrated above 200(mg/dl) or below 110(mg/dl), with few in the middle.
Supplementary Figure 2
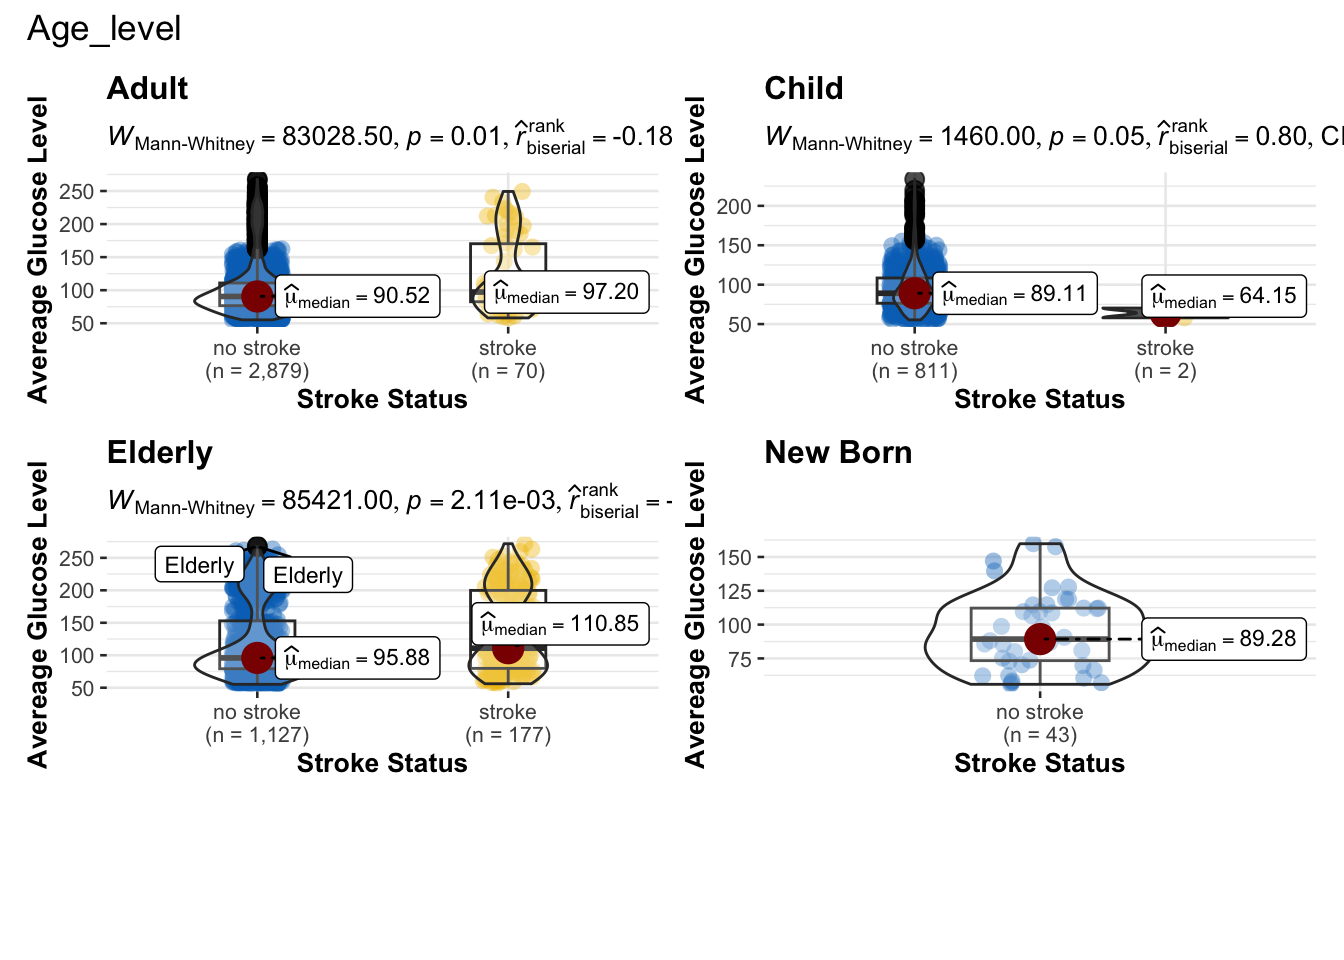
This box violin plot divided objects by age level and conducted Significant tests at each age category. There are no newborn stroke patients and only 2 child stroke patients in this subject which are not sufficient to conduct the significant test. And in adults, the p-value is 0.01, so we can not reject the null hypothesis, while the p-value in the elderly is less than 0.05, therefore we can conclude that average glucose level is significantly different between old stroke patients and old non-stroke patients at a 5% significance level.
Supplementary Figure 3
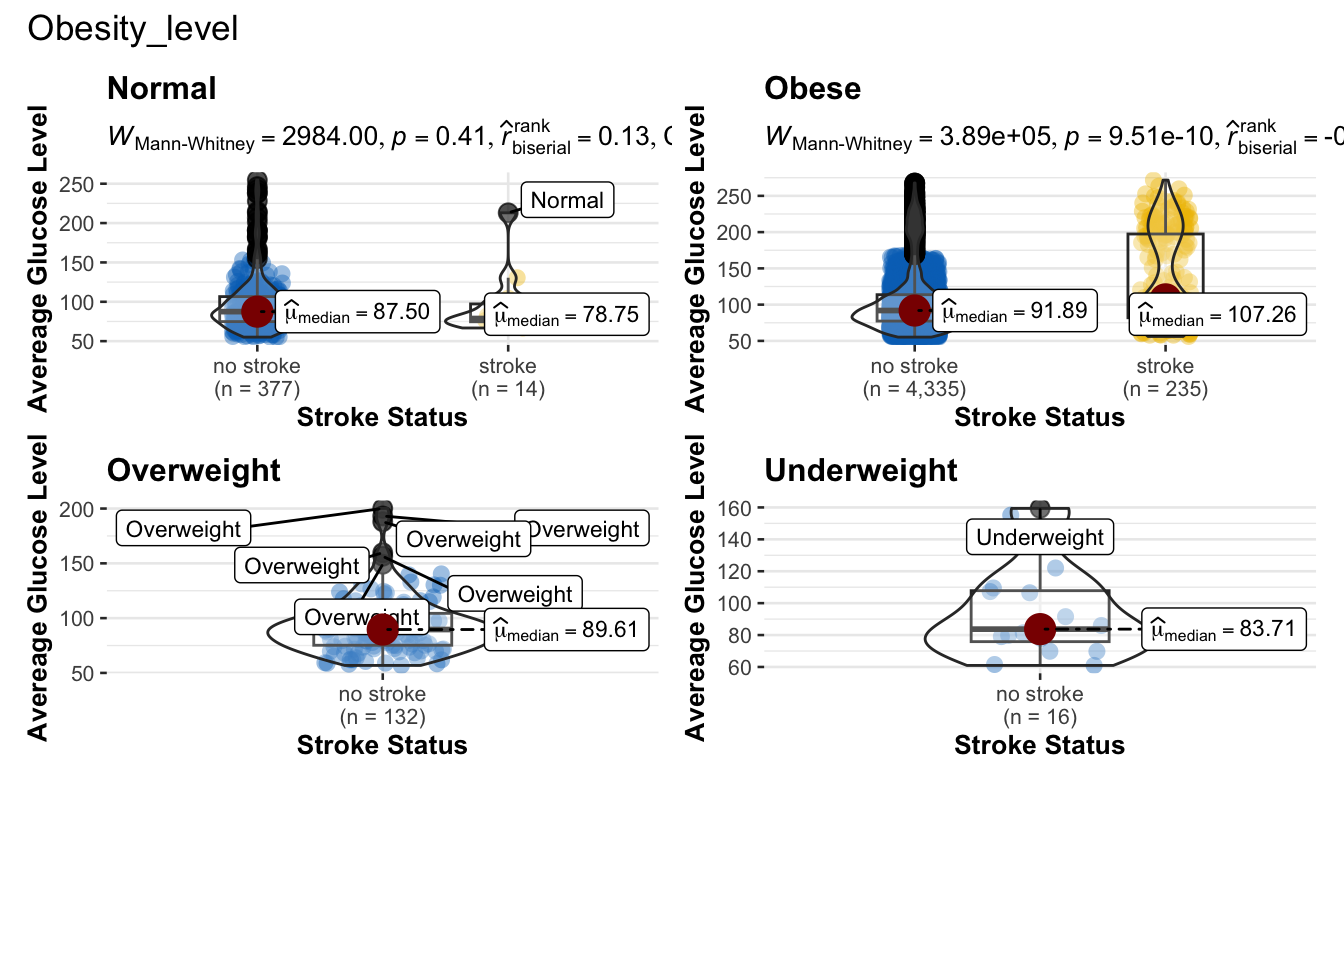
This box violin plot divided objects by obesity level and conducted Significant tests at each BMI category. In the obese category, the p-value is less than 0.05, therefore we can conclude that the average glucose level is significantly different between obese stroke patients and old non-stroke patients at a 5% significance level.
Copyright & copyright; 2022, Yutian (Margery) Liu