Analysis within EHR Stroke data
Yutian
2022-12-07
This is my PM566 Final Project website.
You can download my report from this link Download Report
Note: You can click the Table button at the top to see the three summary tables on the Table page and click the Wilcoxon Test button to check for the significant test. Sometimes it takes time to load the page and please use Open the link in a new tab to see these additional pages in case there might be some loading problems, thanks.
Introduction
Every year, more than 795,000 people in the United States have a stroke[1]. And with the improvement of technology, a lot of data is stored as electronic health records, which allows us to analyze these clinical features. In this project, I will use the medical records from the article `A predictive analytics approach for stroke prediction using machine learning and neural networks Paper. The goal is to find whether there is an association between average glucose level and whether they have had a stroke, and whether there is any relationship between intermediate glucose level and age level or obesity level.
Dataset Information
Stroke data was downloaded from EHR features dataset
In this data set, there are 5110 objects and 12 features as following
- id: Patient ID,unique identifier,Removed since it is not a clinical feature
- gender: Fender of Patient“Male”, “Female” or “Other”,Remove “Other”
- age: Age of the patient
- hypertension: 0 if the patient doesn’t have hypertension, 1 if the patient has hypertension
- heart_disease: 0 if the patient doesn’t have any heart diseases, 1 if the patient has a heart disease
- ever_married: “No” or “Yes”
- work_type:Type of Occupation “children”, “Govt_jov”, “Never_worked”, “Private” or “Self-employed”
- Residence_type: Area type of residence “Rural” or “Urban”
- avg_glucose_level: average glucose level in blood (measured after meal)
- bmi: body mass index Remove Missing Values
- smoking_status:Patient smoking states “formerly smoked”, “never smoked”, “smokes” or “Unknown”*
- stroke: 1 if the patient had a stroke or 0 if not
Questions to be Addressed:
In this study, I want to explore the association between average glucose level value and stroke, also I am wondering if there is any relationship between age and BMI with average glucose level. It can be stepped down as the following questions:
- What it the density of age among stroke patients and non-stroke patients ?
- What it the density of average glucose level among stroke patients and non-stroke patients ?
- What it the distribution of average glucose level among stroke patients and non-stroke patients in different age level ?
- What it the distribution of average glucose level among stroke patients and non-stroke patients in different obesity level?
- Is there significant difference of average glucose level between stroke patients and non-stroke patients?
- Is there significant difference of age between stroke patients and non-stroke patients?
- Is there significant difference of bmi value glucose level between stroke patients and non-stroke patients?
- Is there significant difference between stroke patients and non-stroke in each age level?
- Is there significant difference between stroke patients and non-stroke patients in each obesity level ?
Methods
Data Imputation
sum(is.na(stroke))/nrow(stroke) ## [1] 0.03934234There is only 3% missing values which means imputation is acceptable, mice libraries was used to fo imputation.
imputed_data <- mice(stroke,m=3,maxit = 5,method = 'pmm',seed = 123) ##
## iter imp variable
## 1 1 bmi
## 1 2 bmi
## 1 3 bmi
## 2 1 bmi
## 2 2 bmi
## 2 3 bmi
## 3 1 bmi
## 3 2 bmi
## 3 3 bmi
## 4 1 bmi
## 4 2 bmi
## 4 3 bmi
## 5 1 bmi
## 5 2 bmi
## 5 3 bmi- m = 3, which means to generate 3 filled data
- maxit = 5, the number of iterations to generate filling data each time, here is 5 times
- method = ‘pmm’, the continuous data described above adopts the method of Predictive Mean Matching
Visualizing the missing values
missmap(completestroke)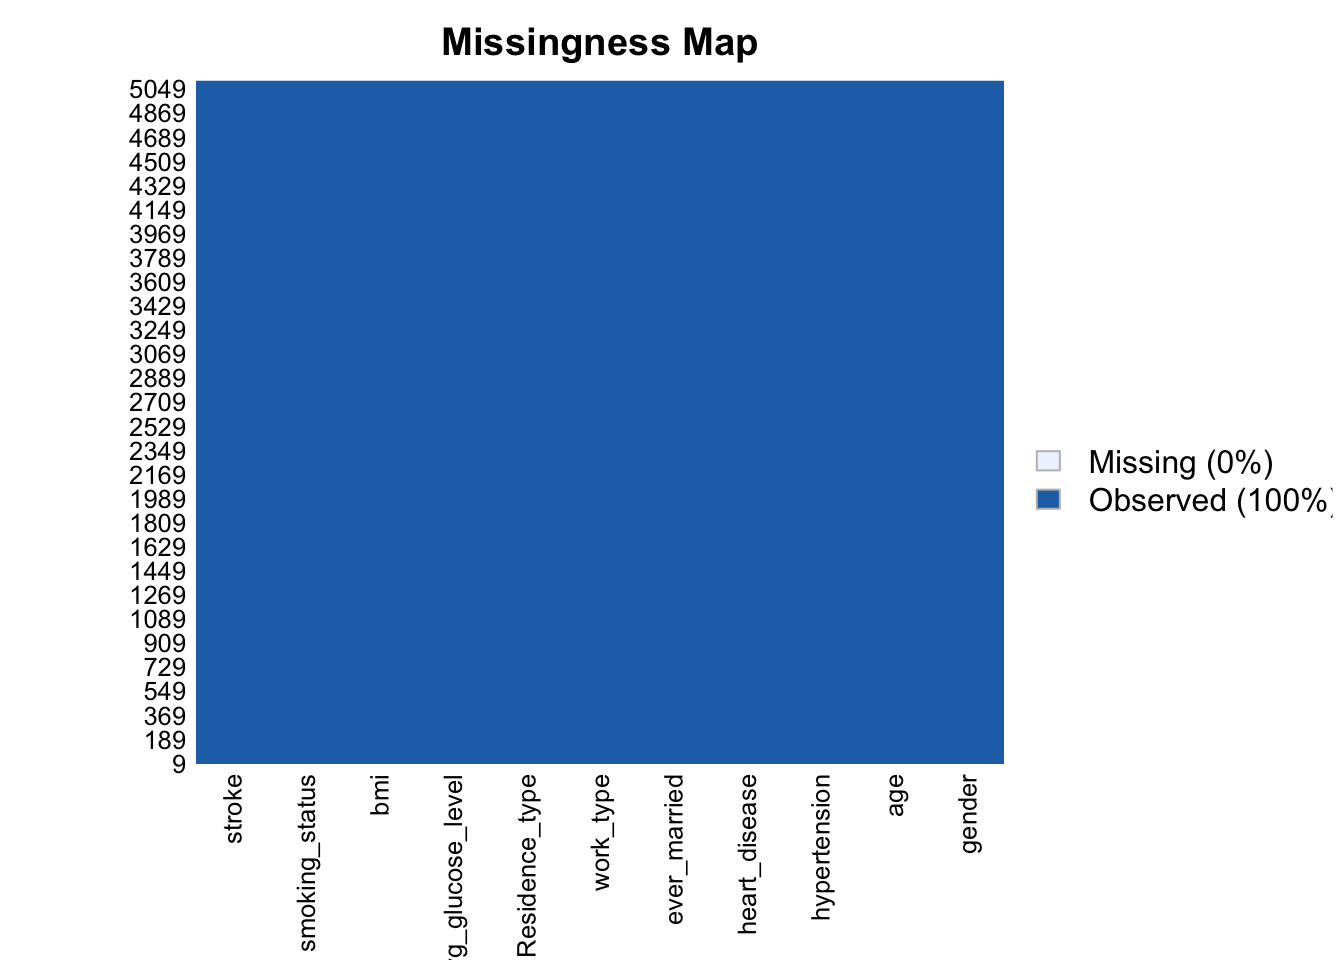
As the image shows,there is no missing value after imputing data
Summary Table
Summary tables are saved at Tables page, there are three tables, one summarizing average glucose level based on stroke status, one summarizing average glucose level based on age level and the other summarizing average glucose level based on obesity level.
Signigicant Test
Wilcoxon test will be performed to compare if there is significant test among two groups, the results are stored at “Wilcoxon Test” page
Results
Showcasing plots
Figure 1
This plot is an interactive density plot that displays the age distribution among stroke patients and non-stroke patients. In this figure, it can be seen that stroke begins when people are about 30 years old, and the density increases considerably steadily while when it comes to patients above 70 years old, the density increases dramatically and reaches a peak at approximately 79 years old.
Figure 2
This interactive density plot shows the density of average glucose level(mg/dl) based on stroke status, it can be seen that the average glucose level of most of the subjects who have not suffered a stroke was less than 150mg/dl while the density of people whose average glucose level above 150mg/dl is higher among stroke patients.
Figure 3
This is an interactive box plot with average glucose level(mg/dl) as y axis,age level as x axis and colored by stroke status.In this figure, elderly and adult stroke patient have the highest avg_glucose_level values, at 110.85 (mg/dl) and 97.2 (mg/dl) respectively.And the Q3 value reached to 200 when it comes to elderly stroke patients.
Figure 4
This interactive box plot displays the average glucose level distribution based on obesity level and stroke status. While there are no underweight and overweight stroke patients, obese stroke patients’ median average glucose level is 107.26(mg/dl) and others are all below 100 (mg/dl).
Copyright & copyright; 2022, Yutian (Margery) Liu